
A cube on disk, and nowhere good to look at it
You have a spectral cube sitting in a folder. Maybe you pulled it from the CADC archive through Verbinal's Search table; maybe you staged it in VOSpace and synced it down; maybe a collaborator handed it to you. Two sky axes, one spectral axis — frequency, velocity, or wavelength — and somewhere inside it the structure you actually care about. A great deal of modern astronomy arrives this way: HI and molecular-line surveys, IFU spectroscopy, radio data cubes, Faraday-depth cubes. All of it lands as a stack of channels you have to look through, not just at. The file is right there. The trouble has always been the looking.
On a Mac, inspecting a cube usually meant one of two detours: a browser tool that wants the data near a remote server, or a notebook session where you write a few cells, render a channel, write a few more, and reconstruct from flat images a thing that is fundamentally three-dimensional. Both work. Neither lets you simply turn the cube in your hands, and neither keeps the data wholly on your machine.
Verbinal for macOS 1.3.0 adds the piece that was missing: the Cube Viewer, a native, GPU-accelerated 3D viewer for FITS spectral cubes, built on Metal and running entirely on your machine. The point is not that a cube viewer exists — they do — but that this one is native, GPU-accelerated, and local-first, with the measurements you would reach for built in. This piece follows one cube through one realistic loop — a first 3D look, a quantitative read at a pixel, an exported figure plate — and explains the controls as they come up. By the end the point should be plain enough to act on: you can drag your own cube onto the window and do all of this without leaving the desktop.
A browser shows you a cube. A notebook lets you measure one. The Cube Viewer does both, locally, in a single native window.
What Verbinal for macOS is, briefly
If you are new to it: Verbinal for macOS is a fast, native companion for the CANFAR Science Portal and the Canadian Astronomy Data Centre (CADC). It is written in SwiftUI for macOS 14 (Sonoma) or later, carries zero external dependencies beyond Apple frameworks, and is free and open source under the Mozilla Public License 2.0. It is on the Mac App Store, ships full English and French interfaces, and needs only a free CANFAR account; your credentials live in the macOS Keychain.
What it already does still holds. You can launch and manage interactive sessions on Skaha — Notebook, Desktop, CARTA, Contributed, Firefly — without a browser; search the CADC archive over TAP; keep a Research workspace for the observations and notes a project accumulates; browse and organise VOSpace storage; view 2D FITS images, Metal-rendered; explore image content discovery; and, since 1.2.5, bridge to your own Claude Desktop or Claude Code over the Model Context Protocol. The Cube Viewer joins that set as another native tool in the same window — one more surface for a kind of data the app could already fetch but could not yet show in three dimensions — not a thing apart.
Opening the cube, and the memory question
The Cube Viewer takes a FITS cube two ways: open it from disk, or drag and drop the file onto the window. The cube can come from anywhere Verbinal already touches — an observation you pulled through the archive search, a file in your Research workspace, something synced from VOSpace — or simply a FITS file in a folder. There is no upload step and no staging server: the cube you point at is the cube it reads, in place.
The honest constraint with cubes is size. A respectable HI or line cube can dwarf the working memory you want to spend on it, and the naive approach — load the whole thing, then look — falls over exactly when the data gets interesting. The Cube Viewer streams large cubes from disk so memory stays in check, rather than insisting the entire volume sit in RAM before it will show you a single channel. That is what lets a survey-scale HI cube or a wide IFU datacube open promptly and stay responsive while you work it, instead of first becoming a question about RAM.
Once it is open you are in one of two modes — Volume for the gestalt, Slice for the measurement — and you move between them freely. They are not separate tools; they are two views of the same loaded cube, and they share their navigation furniture. The same cube, two ways of asking questions of it.
Volume mode: the first look
Start where intuition starts. Volume mode renders the whole cube as a GPU ray-marched 3D volume on Metal, and you explore it directly: orbit to turn it, zoom to push in. For the first time the spectral axis is a real axis you can look along rather than a stack you page through, and the shape of the emission — a rotating disc, a filament threading channels, an outflow leaning out of the plane — is simply there, before you have measured a single number. It is structure that a flat channel map flattens away.
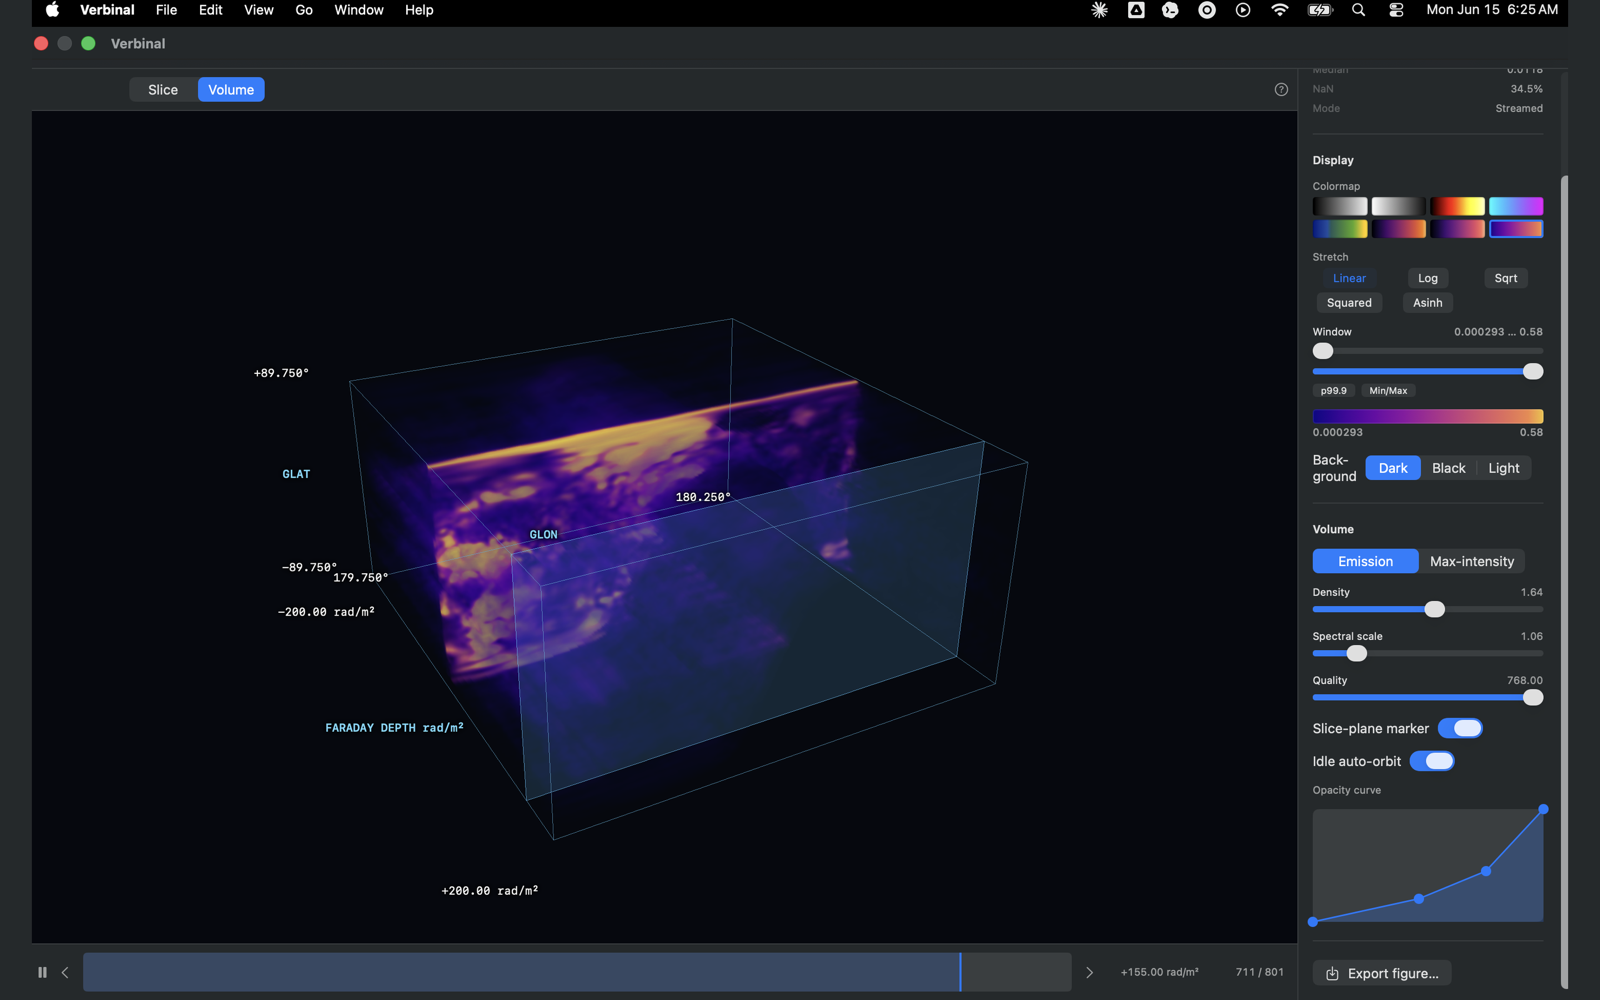
Two projections give you two readings of the same data. emission integrates along each ray, so faint, distributed structure accumulates and shows itself; maximum-intensity keeps the brightest value along each ray, so compact peaks stay sharp. You reach for one or the other depending on whether you are chasing diffuse signal or distinct knots, and switching between them is a fair part of the first look.
From there you tune what the volume shows. Adjustable density and spectral scaling set how strongly the data accumulates and how the spectral axis is stretched against the spatial ones, so a cube that is long and thin in velocity does not render as an unreadable needle. An editable opacity curve is the lever that matters most: it maps value to transparency, so you can dissolve the noise floor and let the real emission carry the image — the 3D analogue of choosing a sensible stretch on a 2D frame. A quality control trades fidelity against responsiveness while you orbit, an idle auto-orbit toggle turns the cube slowly when you step back to think, and a slice-plane marker shows where a given channel sits inside the volume — the bridge to the half of the viewer where you make this quantitative.
Slice mode: the quantitative read
A 3D impression is where understanding starts, not where it ends. Slice mode is the measuring half. It steps through the cube one channel at a time at native resolution — no resampling between you and the pixels you are about to measure — so what you read is what the data says.
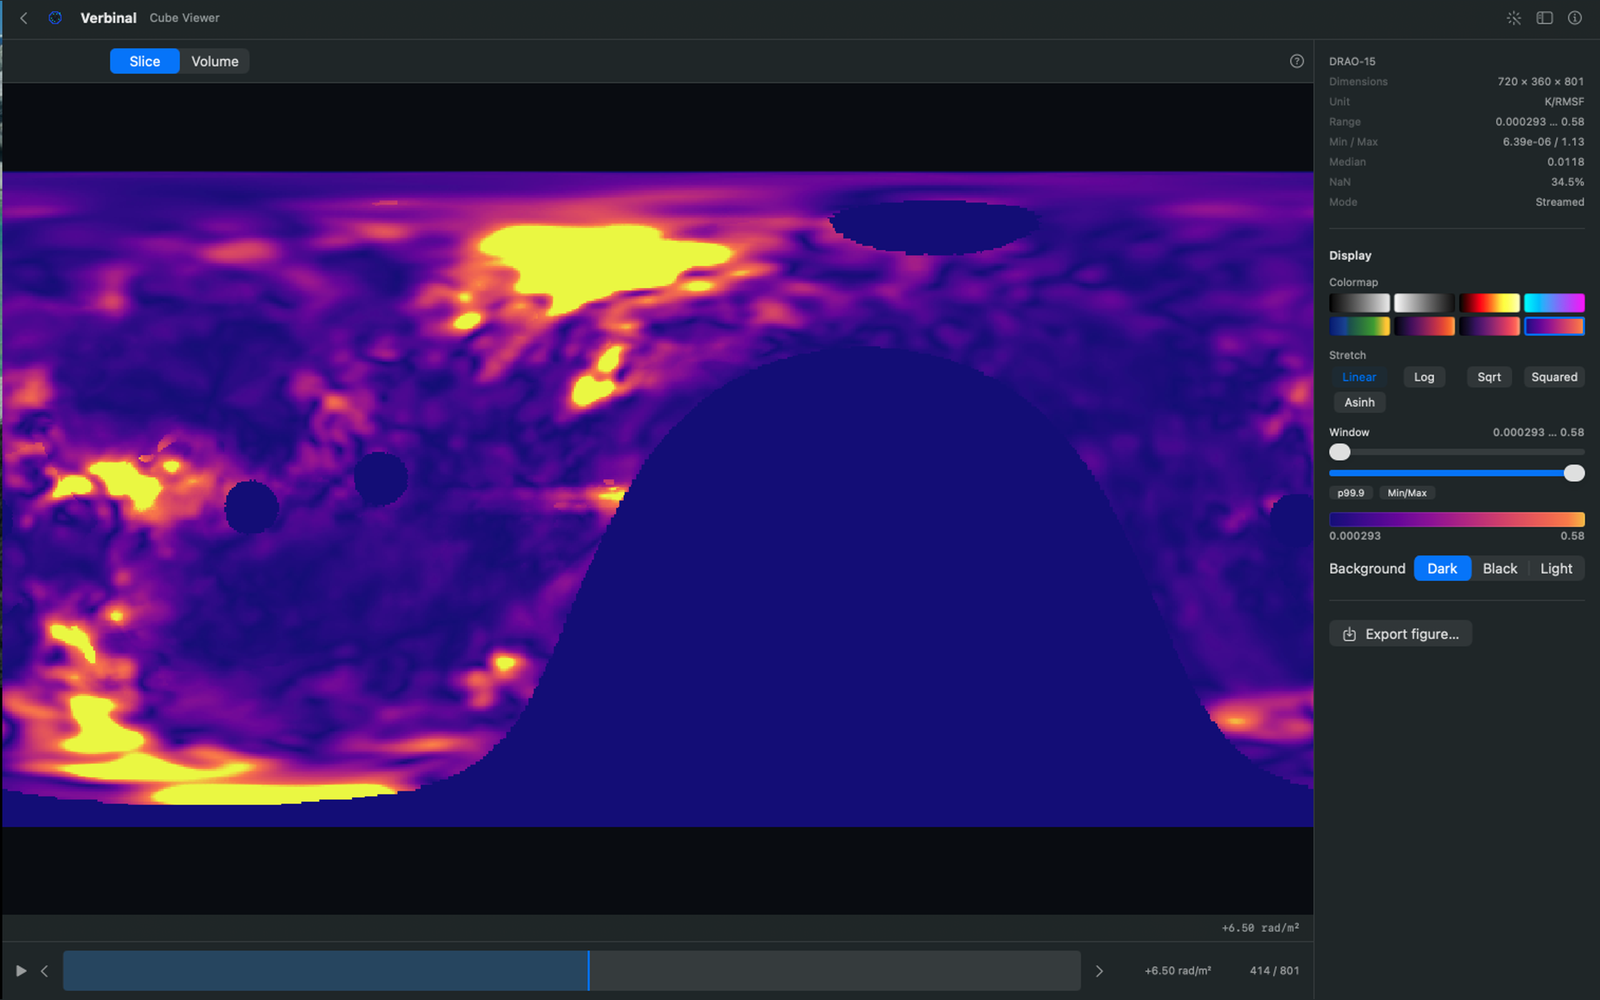
Three readouts turn the picture into numbers:
- WCS sky coordinates. The cursor reads world coordinates from the cube's own header, so a position is a real RA and Dec, not a pixel index.
- Spectral readout. The current channel reports its spectral value in the unit that suits the data — frequency, velocity, or wavelength — following the cube's own spectral axis, not an index you convert in your head.
- Click-to-probe spectrum. Click a pixel and read the full spectrum through the depth of the cube — the line profile at the position you care about, the measurement you would otherwise extract in a notebook, available in the same window where you found the position worth probing.
The qualitative look in Volume mode tells you where to point; Slice mode tells you, quantitatively, what is there.
Navigation both modes share
Whichever mode you are in, the same furniture frames the cube. Axis captions label what each axis is, so a figure is never ambiguous about which way is sky and which way is spectral. Along the bottom runs a channel timeline with a cube-mean waveform scrubber: the mean of each channel drawn as a waveform, so the spectral structure of the whole cube is visible at a glance, and you scrub straight to the channel you want instead of stepping blind. It plays back too, sweeping through the cube when you want to watch the emission evolve rather than step it by hand. The bright bump in the cube mean is usually the channel range worth probing, and the scrubber puts you there in one motion.
Reading the data honestly: display controls
How a cube looks is a scientific decision, not decoration, and the display controls treat it that way. They are the ones you already trust, applied to a cube, on the GPU, in real time:
- Colormaps. Perceptually-ordered scientific maps —
inferno,magma,plasma,viridis, and more — the kind you can publish without a referee querying the colour scale. - Stretches.
linear,log,sqrt,squared, andasinh, the last of these keeping faint extended emission and bright compact cores legible in the same frame. - Window. Set the value range the colormap spans — a percentile such as
p99.9to clip the brightest outliers, orMinMaxfor the full range — so you fix contrast deliberately rather than letting a single hot pixel set the scale. - Background.
Dark,Black, orLight, which matters more than it sounds: the right background is the difference between faint structure you can see and faint structure that vanishes into the canvas.
These choices carry across both modes and straight into export, so the figure you publish shows the data the way you actually read it.
Publication figure export
This is the step that usually sends you back to a notebook, and the one the Cube Viewer is built to absorb. You have the view you want on screen; now you need it at print quality, with the scaffolding a journal expects. Export figure… renders a proper plate, not a screenshot of the canvas: the header, a colorbar, a WCS legend, and the axis captions, composed together as the figure a referee should see.
The output is publication-grade. You can render to PNG at 2× or 4× for high-resolution raster, or to PDF for vector, and choose a light or dark journal theme to match the venue. Font, text-colour, and background controls handle the rest of the house style without leaving the app. Because the colorbar, WCS legend, and captions are rendered into the export, the figure is self-describing — the reader can see the colour scale, the coordinates, and what each axis is, without a separate caption doing all the work.
One cube, look to figure
Put the pieces together and the arc is short, which is the point. Suppose you have a line cube on disk — downloaded through Verbinal's archive search into your Research workspace, or synced from VOSpace.
- Open it. Drag the FITS cube onto the Cube Viewer, or open it from disk. A large one streams rather than swallowing your memory, and you are looking at it promptly.
- Get the gestalt. In
Volumemode, orbit and zoom; pickemissionormaximum-intensity; tune density, spectral scale, and the opacity curve until the noise floor falls away and the structure stands out. You now know the shape of the thing, and roughly where the interesting velocities are. - Make it quantitative. Switch to
Slicemode. Read real WCS positions and a velocity or frequency at the channel you care about, then click-to-probe the spectrum at the pixel that caught your eye. - Navigate the spectrum. Scrub the channel timeline on its cube-mean waveform to land on the line, and play through it to confirm the feature is real across channels rather than a single-channel artefact.
- Export the figure. Choose a stretch and colormap that read honestly, set a dark journal theme, and
Export figure…— colorbar, WCS legend, and captions — to PDF or high-resolution PNG, straight into the paper.
Qualitative look, quantitative read, publishable figure: one native window, one sitting, and no server in the path. You went from a file you could not really see to a plate you can submit without ever opening a browser tab or writing a cell.
Where it lives, and the rest of 1.3.0
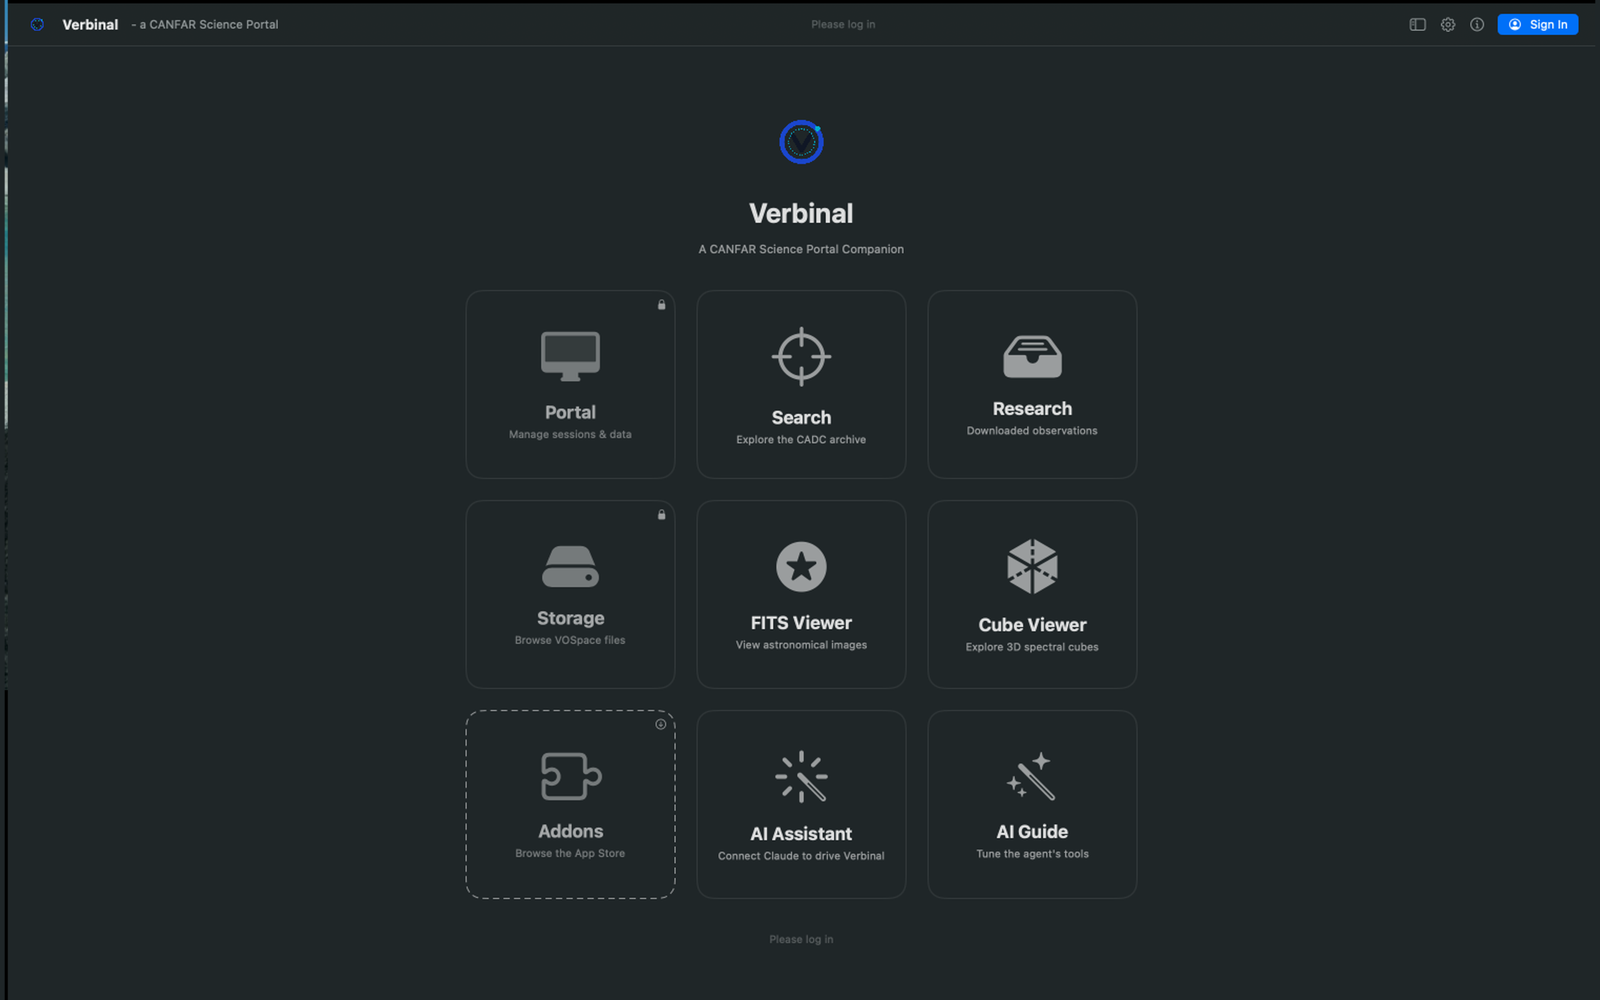
The viewer is one tile away. The Welcome screen gains a Cube Viewer tile — Explore 3D spectral cubes — alongside Portal, Search, Research, Storage, FITS Viewer, Addons, AI Assistant, and AI Guide, so the path from opening the app to dragging in a cube is short and obvious.
Around the headline, 1.3.0 brings the polish a point release earns its number with. Rendering in the cube and volume views is leaner and faster, with lower memory use — which is what makes streaming a large cube comfortable rather than just possible. The universal build is refined for both Intel and Apple-silicon Macs, so the same app runs well whichever you are on; and there is the usual round of bug fixes and stability improvements. None of it is loud. It is the kind of polish you notice as an absence of friction rather than a feature you point at.
Privacy, source, and how to get it
The privacy posture is unchanged, which is the point. Verbinal collects no data, runs no analytics, and ships no telemetry. Your CADC credentials live in the macOS Keychain, and network traffic — the archive searches and storage transfers that put the cube on your disk in the first place — goes directly to CANFAR and CADC over HTTPS, with no third-party servers in the path. The Cube Viewer keeps that promise the most literally of any feature: a cube you open is read on your own machine and rendered on your own GPU. Nothing about it is uploaded, and no server ever sees the data the figure was made from.
Verbinal for macOS is free and open source under the Mozilla Public License 2.0, with the full source at github.com/szautkin/canfar-macos — so the rendering, the WCS handling, and the export described here are something you can read rather than take on faith. Requirements are unchanged: macOS 14 (Sonoma) or later and a free CANFAR account from canfar.net. Download it from the Mac App Store, open the Cube Viewer tile, and drag one of your own cubes onto the window. The first time you turn one in 3D, land on the channel that matters, probe a spectrum, and export the plate without leaving the Mac, the old detours stop feeling necessary.
Get Verbinal for macOS
Free and open source. macOS 14 or later and a free CANFAR account. The Cube Viewer opens any FITS spectral cube on your Mac — no server in the path.